
Ashok Leyland provides a clear, real-world case study of how market structure repeats — and how traders can interpret that structure using the PEMA (Pivot-Based EMA) method. Instead of trying to predict price, PEMA focuses on context: identifying whether the market is compressing, breaking out, or trending. This perspective transforms chart reading from emotional decision-making into a structured framework. By studying how exponential moving averages behave, traders can recognize when conditions favor patience, when momentum is emerging, and when continuation opportunities are present.
Identifying the Range Phase With EMA Compression
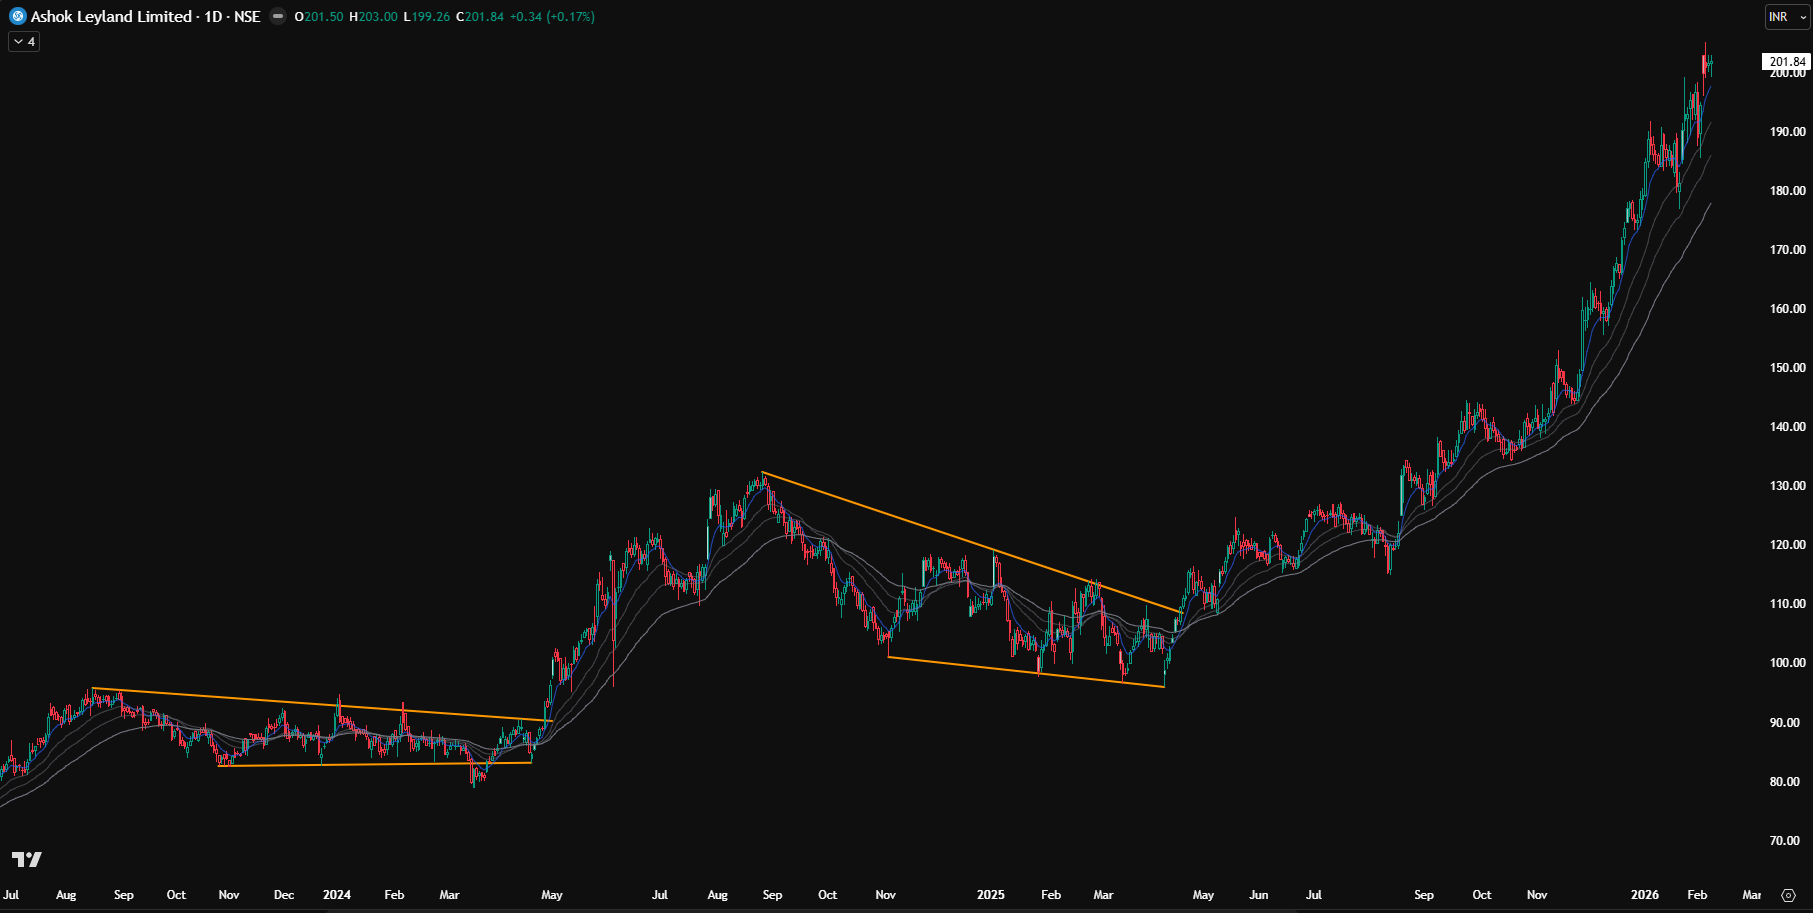
Looking at Ashok Leyland’s chart between September 2023 and April 2024, and again from September 2024 to April 2025, we see a repeating equilibrium structure. During these periods, price moved sideways while multiple EMAs repeatedly overlapped and hugged each other. This behavior signals balance between buyers and sellers. Momentum attempts fail to follow through, and price oscillates around the EMA cluster.
Within the PEMA framework, this compression phase is not random noise — it is information. When EMAs compress tightly, the market is negotiating value. Trend-following entries often struggle in this environment because directional conviction is absent. Traders who recognize this condition shift their focus from aggressive participation to observation. Ranges act as energy storage zones. The longer compression persists, the more meaningful the expansion that follows tends to be.
Breakout: Transition From Balance to Imbalance
Every equilibrium phase eventually resolves. On the Ashok Leyland chart, both range structures ended with decisive breakouts. The critical confirmation was not price movement alone but EMA behavior. The moving averages stopped overlapping and began expanding while aligning in one direction. This expansion signals a shift from negotiation to commitment — participants are now expressing directional intent.
For PEMA traders, this moment marks a change in market environment. The sideways structure that once produced whipsaws now transitions into a directional opportunity. Breakouts supported by EMA expansion are more than volatility spikes; they represent imbalance. Recognizing this structural shift allows traders to align with emerging momentum rather than reacting late.
Trending Conditions and EMA Pullback Opportunities
Once EMAs align and move together in a consistent direction, the market enters a trending phase. Ashok Leyland demonstrated this clearly after both breakout periods. Price advanced while repeatedly retracing into the EMA cluster before continuing higher. These pullbacks are not signs of weakness — they are structured pauses within an established directional move.
The EMA zone acts as dynamic support in an uptrend. From a PEMA perspective, this area represents value within momentum. Traders use these retracements to enter with improved risk positioning rather than chasing extended price action. This behavior reflects how trends naturally unfold: expansion, controlled pullback, continuation. Reading this rhythm helps traders participate with structure instead of emotion.
The Repeating Cycle of Compression and Expansion
What makes this case study powerful is how clearly it illustrates the cyclical nature of markets. Ashok Leyland moved through a recognizable sequence: compression, breakout, trend, and eventual re-compression. This rhythm is not unique to one stock — it is embedded in market behavior.
The PEMA method is designed to read this cycle. EMA compression favors patience and preparation. Expansion signals emerging opportunity. Alignment confirms continuation conditions. By focusing on structure instead of prediction, traders gain clarity about when to act and when to wait. This reduces impulsive decisions and improves consistency.
Practical Takeaways for Traders
EMA behavior reflects collective psychology. Compression signals uncertainty. Expansion indicates conviction. Alignment shows sustained directional agreement. The Ashok Leyland chart demonstrates how these structural cues repeat across trend cycles. Traders who learn to read EMA relationships can avoid range traps, anticipate breakout phases, and engage trends with greater confidence.
The PEMA framework does not aim to forecast exact price levels. Instead, it answers more actionable questions: Is the market balanced or trending? Is momentum developing or fading? Is this an environment to prepare or participate? These answers guide decision-making in a structured way.
Continuing Your Learning With the PEMA Framework
Ashok Leyland’s repeating range and expansion cycles reinforce a key trading principle: structure leaves clues. Understanding EMA compression and alignment allows traders to operate on probability rather than impulse. For a deeper step-by-step breakdown of how to apply this framework, read PEMA – Pivot Based EMA: The Fast-Momentum Moving Average System Every Trader Should Learn at https://msptraders.in/pema/. For ongoing chart studies, insights, and practical applications of structure-based trading, follow me on social media to continue developing your market reading skills.
Markets move in cycles, and traders who learn to recognize those cycles position themselves to act with clarity instead of reaction.
Cheers !!
Arup MSP
Creator of Pivot Mastery (The Practical Way to Understand Market Context)
Social Profiles:
Follow on X
Follow on Facebook