Bloom Energy Corporation (BE), a leading name in solid-oxide fuel cell technology, has recently experienced a sharp correction that attracted the attention of traders and investors. Over the past few weeks, the stock has dropped close to forty percent, creating concern among short-term traders but also presenting an important learning opportunity about trend exhaustion, price acceptance, and higher-timeframe pivot structures. Although the fall looks intense on the surface, the deeper market structure tells a more balanced story.
A Steep Decline After an Extremely Overextended Trend
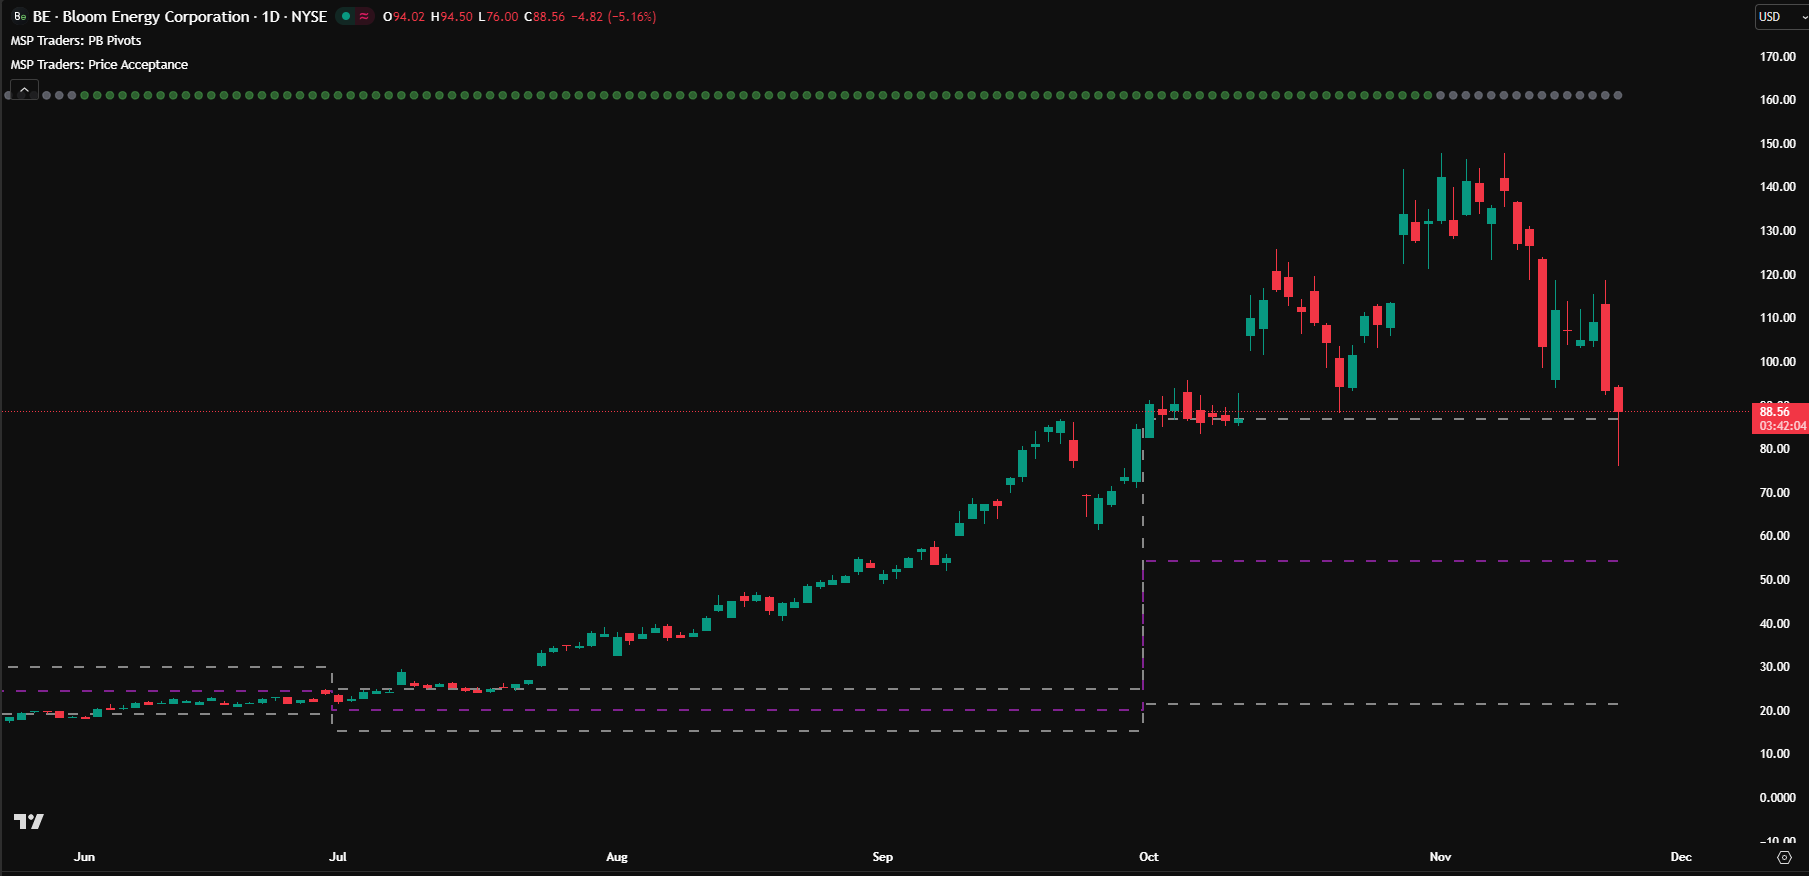
Before the recent selloff, BE was enjoying a remarkably strong bullish phase. Your green-dot trend indicator had already been signaling sustained upward momentum. The stock did not simply trend upward—it exploded. It traveled almost three times its normal monthly range, touching nearly two hundred ninety-five percent extension. Even more impressively, it stretched beyond three times its average quarterly range, printing a three hundred thirty-nine percent move. These are not ordinary expansions. Such extreme displacement typically hints at a buying climax—a situation where price accelerates beyond realistic sustainability because late buyers chase the move while smart money quietly begins distributing their positions.
When any asset moves far beyond its historical behavior, the probability of a pullback rises sharply. BE’s vertical move put it into a zone where the risk-reward flipped against buyers. So while the forty percent correction looks painful, it is actually consistent with what market theory expects after a climax phase.
From Buying Climax to Profit-Taking Pullback
A buying climax represents the final stages of a euphoric rally. Momentum becomes unsustainably high, volume spikes, and participants begin entering impulsively rather than logically. At that stage, institutional players—who fueled the initial move—begin taking profits. This is where the first signs of trouble typically appear: larger candles, wider ranges, and disturbed trend smoothness.
Bloom Energy mirrored this pattern. After the massive rally, the pullback that followed was not a random selloff but a structured reaction to overstretched conditions. The pullback has been strong because profit-taking from large players disrupts the rhythm of the trend. However, a disrupted trend does not automatically mean a reversal. It simply indicates the start of a transition phase, where the market begins searching for a new fair value area.
Entering the Price Acceptance Phase
After every strong trending move, markets eventually pause to build balance. This pause is known as the Price Acceptance Phase, where the behavior changes completely. Price stops trending directionally and instead begins oscillating inside a range. Neither buyers nor sellers dominate. Volume normalizes as traders reassess.
Bloom Energy is beginning to enter this stage. The prior trending strength has cooled, and the market is no longer pushing aggressively upward or downward. Instead, it is forming what looks like the early stages of a trading range. In this phase, price essentially rebuilds energy for its next move. The next leg can either continue upward if bulls regain control at higher-timeframe levels, or slide lower if support levels break and sellers step in with conviction. This is a normal and healthy part of market structure, especially after a three-hundred-percent expansion.
Today’s Candle Reveals Early Signs of Buyer Interest
One of the most important observations in the current structure is today’s candle. Although the candle has not yet closed, the presence of a healthy lower wick suggests that buyers are responding. A wick is a visual representation of rejection. It shows that when the price dipped, demand stepped in to absorb the selling pressure.
This rejection is not random. The reaction is occurring exactly around the previous quarter’s high, combined with the previous month’s low—a powerful confluence zone. These levels commonly act as structural support when viewed from a higher-time frame perspective. For swing traders, such areas often become logical locations for buyers to test their conviction.
However, it is necessary to wait for the candle to close. A developing wick can disappear if late-session selling kicks in. If this support ultimately fails, price is likely to slide down to the previous quarter’s midpoint and, if selling pressure continues, toward the previous quarter’s low. These levels act as magnets in multi-timeframe analysis, and the reaction around them helps traders understand where the next balance area may form. This is an excellent example of why higher-timeframe analysis is essential in swing trading and why HTF pivot concepts play a significant role in identifying meaningful support and resistance.
Higher-Timeframe Trend Still Bullish
Despite this short-term turbulence, the higher-timeframe trend for BE is still bullish. The long-term structure has not shown a reversal pattern. The quarterly pivot levels remain favorable for bulls, and historically, these levels tend to attract buyers after major expansions. The market is simply cooling down after an overheating phase. If buyers defend these areas well, the stock can resume its primary trend once the acceptance phase completes.
A critical technical factor to watch is the monthly closing relative to the CPR (Central Pivot Range). If the month closes above the CPR, the bullish bias remains intact, suggesting that this pullback was nothing more than a temporary correction within a bigger trend. If the price closes below CPR, the stock may shift into a wider trading range, using the next few weeks or months to consolidate before any meaningful direction emerges.
Conclusion
Bloom Energy’s recent fall has created alarm among short-term traders, but the bigger picture shows a much more orderly structural behavior. The decline is a natural response to a buying climax driven by a three-hundred-percent expansion in both monthly and quarterly ranges. The market is now transitioning into a healthy acceptance phase, where it will balance out before choosing its next direction. Today’s candle shows early signs of bullish defense at significantly higher-timeframe confluence zones, but the final confirmation will only come with the closing price.
Overall, BE remains bullish from a broader perspective, especially if monthly price action holds above the CPR. The coming weeks will determine whether the stock resumes its upward path or spends more time inside a consolidation range, building the energy needed for the next major move.
Cheers !!
Arup MSP
Creator of Pivot Mastery (The Practical Way to Understand Market Context)
Social Profiles:
Follow on X
Follow on Facebook