The stock has been consolidating for the last three months, and as seen in the chart, price is travelling inside a defined trading range.
This October looks to be a significant month. Notice the white dotted areas on top— these appeared right after the green dots, which in my mechanical framework indicate that the price was in an uptrend and is now taking a pause.
This behavior represents a concept I call Price Acceptance — a natural phase that usually occurs after a strong bull run or bear run.
In this case, CK Hutchison has already moved over 30% to the upside in the past few months, and now the market seems to be accepting that higher price zone before deciding its next direction.
On my chart, these green and white dots appear automatically, reflecting this process mechanically — no manual drawing needed.
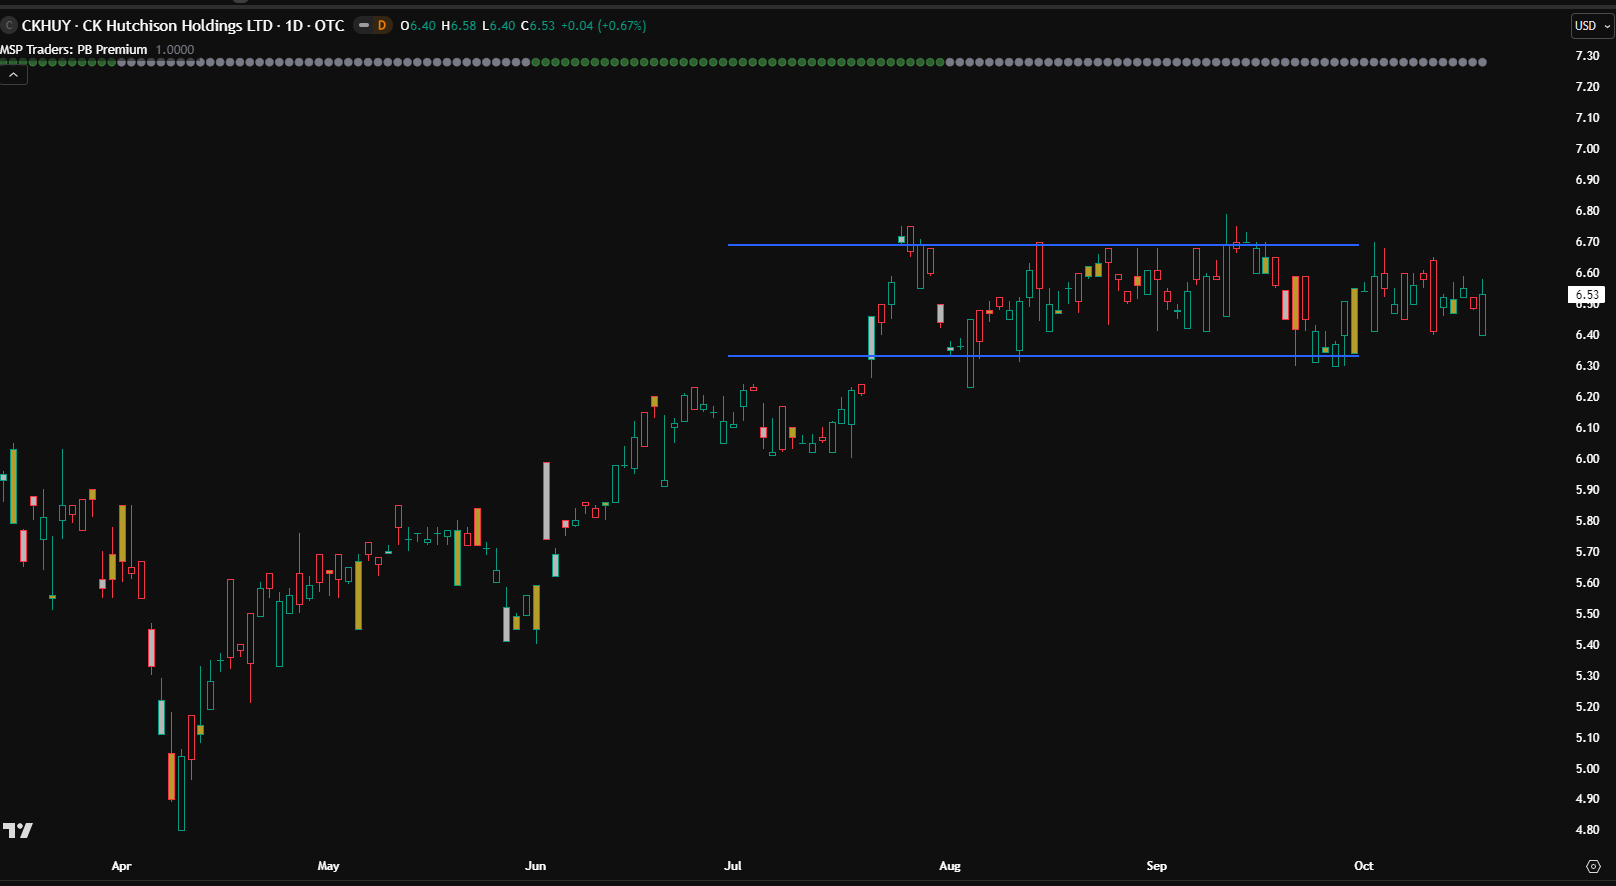
Now, the key point to watch:
👉 If the bulls still hold strength, we should see an upside move this month.
However, if price gets accepted inside this range for a few more months, it would suggest that buyers are losing momentum — and we could then see a further downside move, potentially back toward the 4.5 to 5 zone, where this previous rally began.
Cheers !!
Arup MSP
Creator of Pivot Mastery (The Practical Way to Understand Market Context)
Social Profiles:
Follow on X
Follow on Facebook