
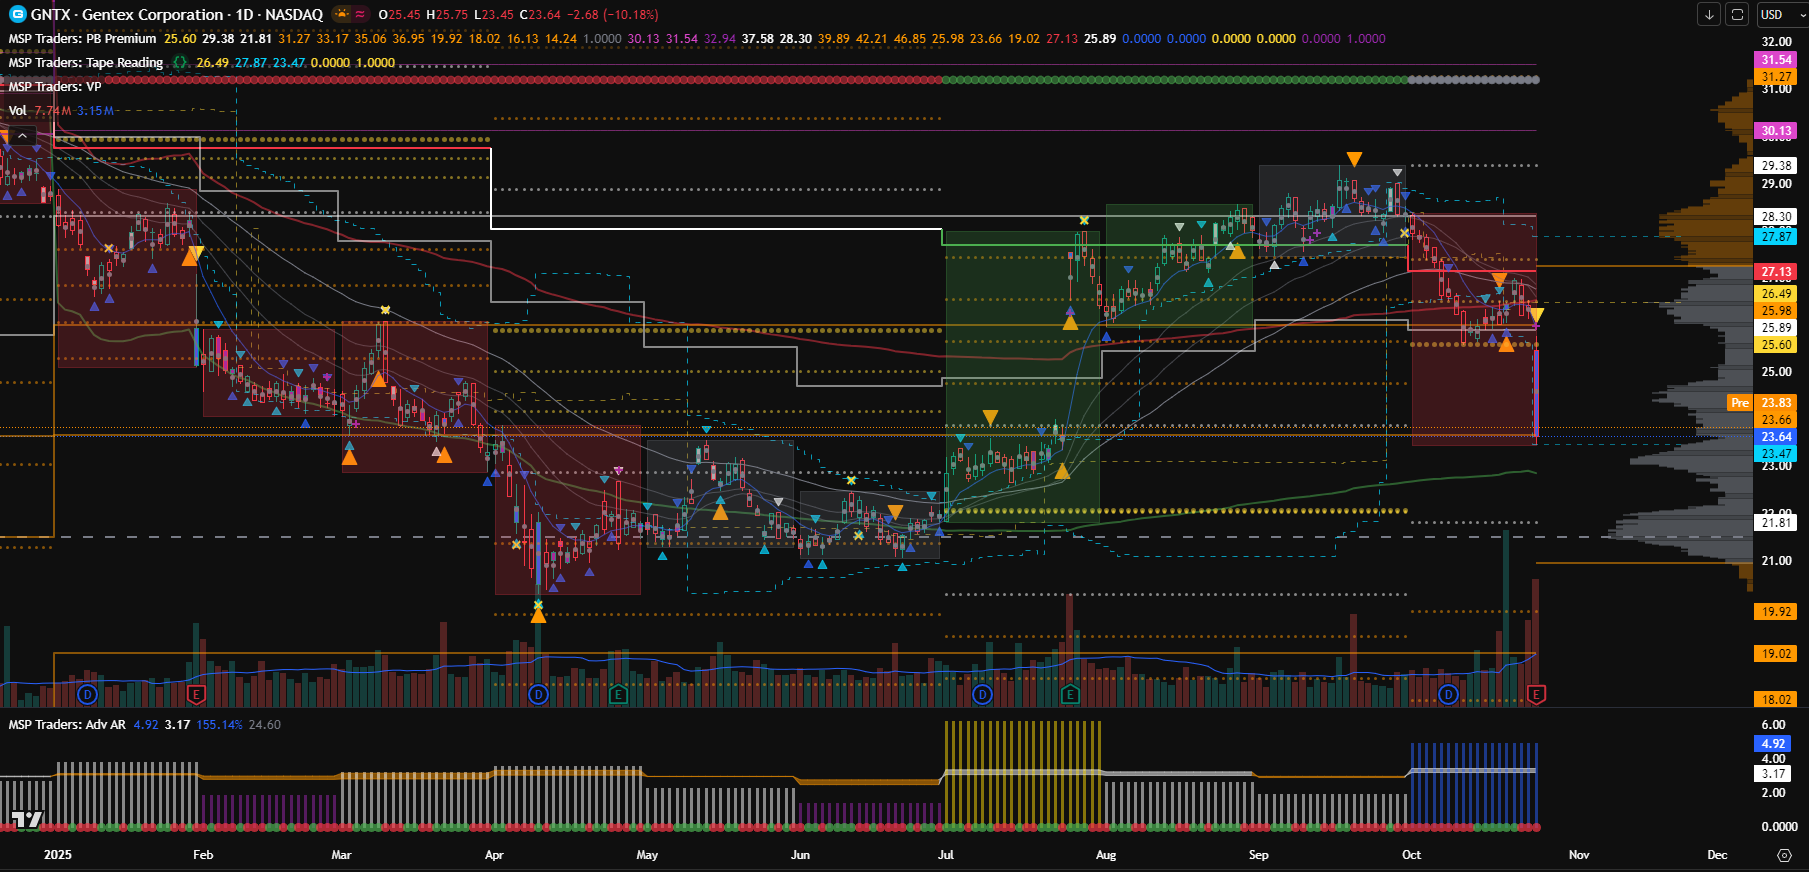
Friday’s session was brutal for Gentex Corporation (GNTX) as the stock dropped nearly 10% in a single day. At first glance, the chart looks extremely bearish — but let’s step back and break down what’s really happening at the current level.
🧭 Step 1: The Bigger Picture
Whenever I analyze a stock, I always begin with the higher timeframe context — it’s like checking the weather before sailing.
Here’s what stands out for GNTX right now:
- Price is already below the PYL
- The QPEMA is sloping down, confirming longer-term bearish momentum
- Price has also YVAH and is now approaching the YPOC
If these terms sound confusing, don’t worry — I’ve explained every one of them in detail here 👉 Trading Jargons Explained
These combined signals clearly show that the bigger trend is bearish. The stock is trading below major reference levels, and sellers are still in control.
🧩 Step 2: Key Support Zones to Watch
Even in a strong downtrend, markets move from one balance zone to another. Right now, I’m watching three critical zones — $19, $20, and $21.
Why these levels?
Because price has historically taken support here multiple times — in April, May, and June this year and in 2020 during Covid crash. That makes it a strong potential demand area where buyers might try to defend.
If the stock stabilizes around this zone, we could see a short-term bounce, but it’s important to note: even if support holds, that does not make the trend bullish. At best, it might lead to a temporary range-bound or sideways move.
🔺 Step 3: Resistance Zone and What’s Next
The major resistance for now is around $28 — a key supply zone that has repeatedly capped the upside. Given the overall context, it’s unlikely to be broken easily this year, unless something fundamentally changes or market sentiment turns sharply positive.
That said, markets are full of surprises. So, I’ll keep tracking how price behaves around these key zones.
If the $19–$20 support area fails to hold, we might see a deeper correction toward even lower levels as the downtrend extends.
📊 Final Thoughts
To sum it up:
- The long-term structure is bearish
- Price is below all major key levels
- Support zone: $19–$21
- Resistance zone: $28
Keep your eyes on how the market reacts around these levels — that will reveal whether sellers still dominate or if buyers are finally stepping in.
If you found this breakdown useful, you’ll love these related posts that go deeper into the same trading concepts:
👉 Price Acceptance — The Core Principle Behind Every Trend
👉 HTF Analysis — Following the Big Players
👉 Using CPR as a Powerful Trend Detector in Trading
Disclaimer: This post is for educational purposes only and not financial advice. Always do your own research or consult a registered financial advisor before investing.
Cheers !!
Arup MSP
Creator of Pivot Mastery (The Practical Way to Understand Market Context)
Social Profiles:
Follow on X
Follow on Facebook