
The Nifty 50 Index has been structurally bullish on a higher-timeframe view. Instead of debating whether the market is bullish, this case study focuses on how a bullish market actually behaves at the micro level and how traders can align themselves with that behaviour.
Following the publication of a detailed Nifty IT Index reversal case study, here is another real-world example using the PEMA method. The goal is not prediction but observation—understanding how price reacts around structure, pivots, and moving averages during different phases of a trend.
This study is intentionally limited to 2–3 quarters of data, because as a short-term swing trader, extending the view too far often adds noise rather than clarity. That said, the logic of the method remains the same across all timeframes, whether you trade daily, weekly, or even intraday charts.
A Quick Scan from April 2025: Establishing the Context
Let’s put on a “Google-style scanning lens” and start from April 2025.
From April through May and into June, the Nifty 50 showed a clean and strong up-move. This phase was marked by expansion—wide bullish candles, acceptance above key averages, and very little overlap. Markets behave like this only when participation is broad and confidence is high.
This is important because every pullback must be judged relative to what came before it. A strong rally changes the probability framework for what follows.
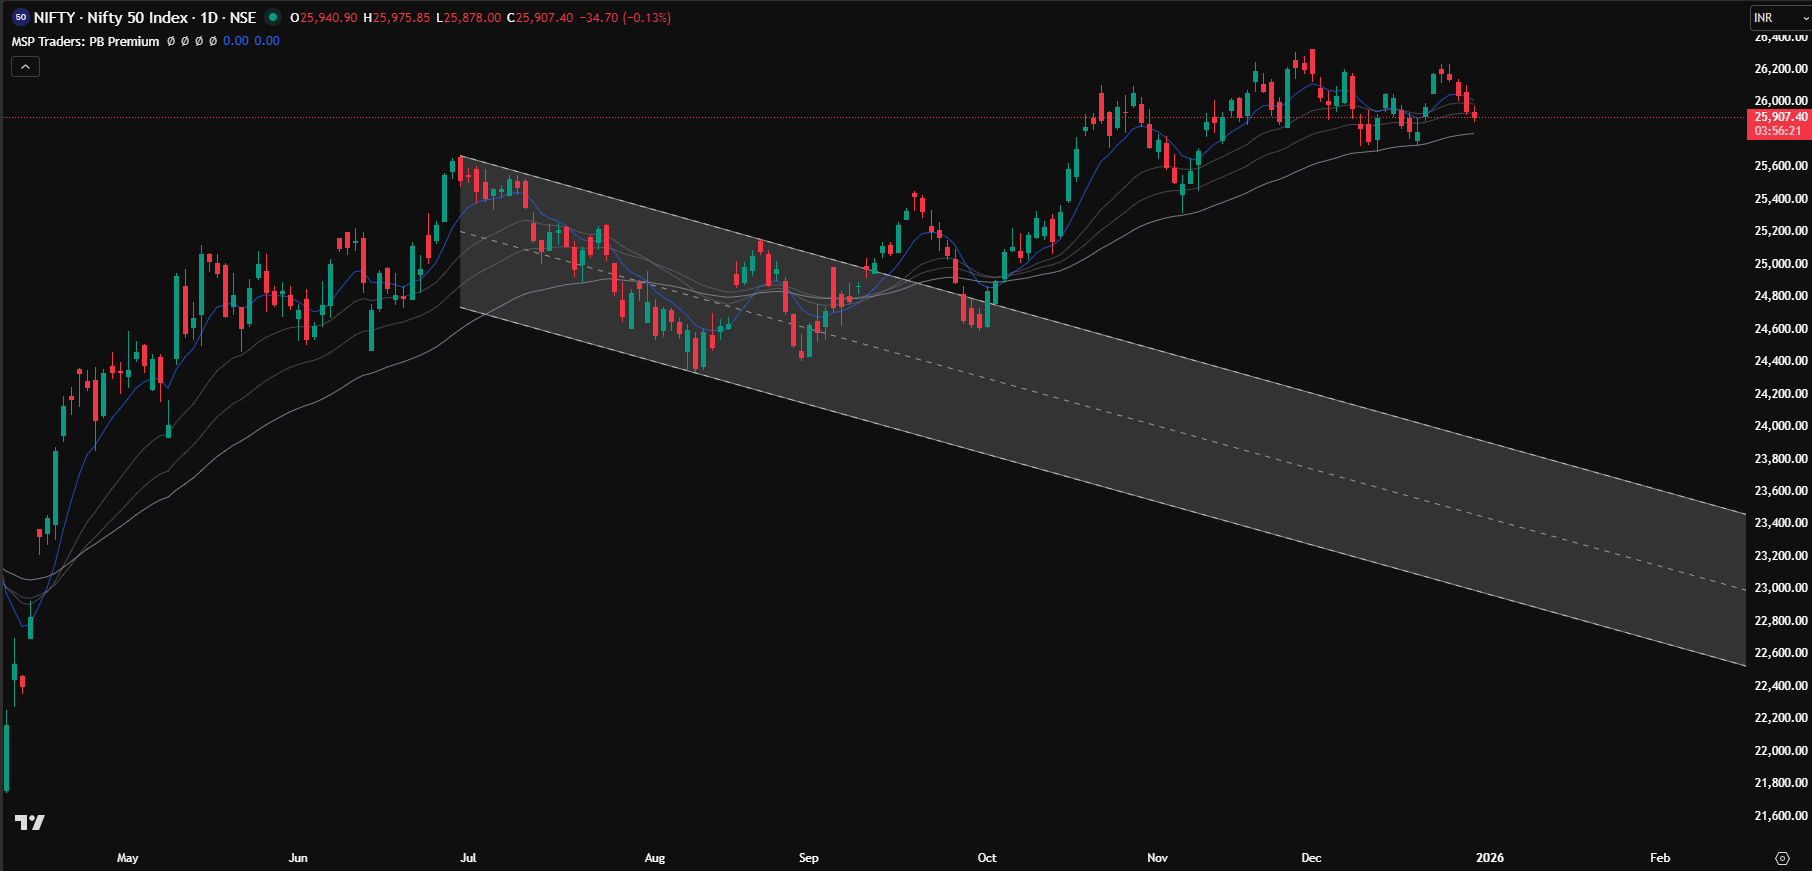
July Onwards: Pullback, Not a Fall
From July, the index entered what many traders emotionally label as “weakness”. But structurally, this was not a fall—it was a pullback.
There is a critical difference.
After a strong rally, price rarely collapses immediately unless there is a major fundamental shock. Most of the time, markets pause, digest gains, and form either a narrow range or a small corrective channel before deciding the next direction.
This digestion phase is where most traders get trapped—either exiting too early or aggressively shorting into support.
Zooming into the Pullback: Reading Price Action Correctly
When we zoom into this pullback phase, price action tells a clearer story.
The simplest way to differentiate a pullback from a downtrend is by observing structure, especially lower lows.
In August, the price slipped below the PEMA zone. For many traders, that single event is enough to flip bearish. But structure matters more than levels.
Despite trading below PEMA, the price failed to continue lower. There was no expansion to the downside and no decisive lower low. This failure itself is information.
Understanding PEMA in This Context
PEMA stands for Pivot Based EMA. It is not just another moving average; it is an adaptive reference built around market structure and pivots, helping traders read acceptance and rejection more clearly.
PEMA is discussed in detail separately, but for this case study, its role is simple:
It acts as a dynamic decision zone, not a buy-sell switch.
Price trading below PEMA does not automatically mean bearishness. What matters is what price does next.
Mid-August to September: Bulls Quietly Take Control
In mid-August, Nifty formed a swing low. Later in August, price tested lower again—but this time, it created a higher low.
This was the first real sign that bulls were stepping back in.
By the end of September, the price made yet another higher low and finally broke out of the downward corrective channel. This breakout was not sudden or emotional—it was earned through repeated failed attempts by sellers.
Once the channel broke, the market confirmed its bullish bias, and the following three months resumed the uptrend.
The Bigger Lesson: A Cycle That Repeats Endlessly
What happened here is not unique to the Nifty 50.
This cycle—
strong rally → controlled pullback → failed lower low → higher low → breakout—
repeats endlessly across markets and timeframes.
The edge does not come from predicting tops or bottoms. It comes from identifying these transitions early, when risk is defined and structure is clear.
Traders who learn to spot failed moves and structural shifts gain clarity, patience, and consistency—three things no indicator alone can provide.
Final Thoughts
The Nifty 50 case study reinforces a simple truth:
Markets speak through structure before they move through price.
By combining price action, PEMA, and context, traders can stay aligned with the dominant trend while avoiding emotional decisions during pullbacks.
This is not a one-time pattern. It is a framework—and once learnt, it can be applied again and again.
Cheers !!
Arup MSP
Creator of Pivot Mastery (The Practical Way to Understand Market Context)
Social Profiles:
Follow on X
Follow on Facebook