
Pivot-based EMA, or PEMA, is designed to help traders read trend structure instead of reacting emotionally to price movement. Rather than relying on a single moving average. In this SBI PEMA Trend Case Study, you will learn how I use a layered set of pivot-derived EMAs to show how momentum flows across different time horizons. This structure gives traders a clearer framework for identifying trend conditions, trading pullbacks, and managing positions with discipline.
If you want a deeper explanation of the core concept behind pivot-based EMA, you can read the foundation article here: https://msptraders.in/pema/
In this SBI case study–style guide, we focus on how a trending phase develops under PEMA, how to enter intelligently during pullbacks, and how to manage trades when market behaviour changes.
Identifying a Trending Phase with PEMA
A PEMA trending phase is defined by alignment, not opinion. When the EMAs are stacked in sequence and sloping in the same direction, momentum is synchronised.
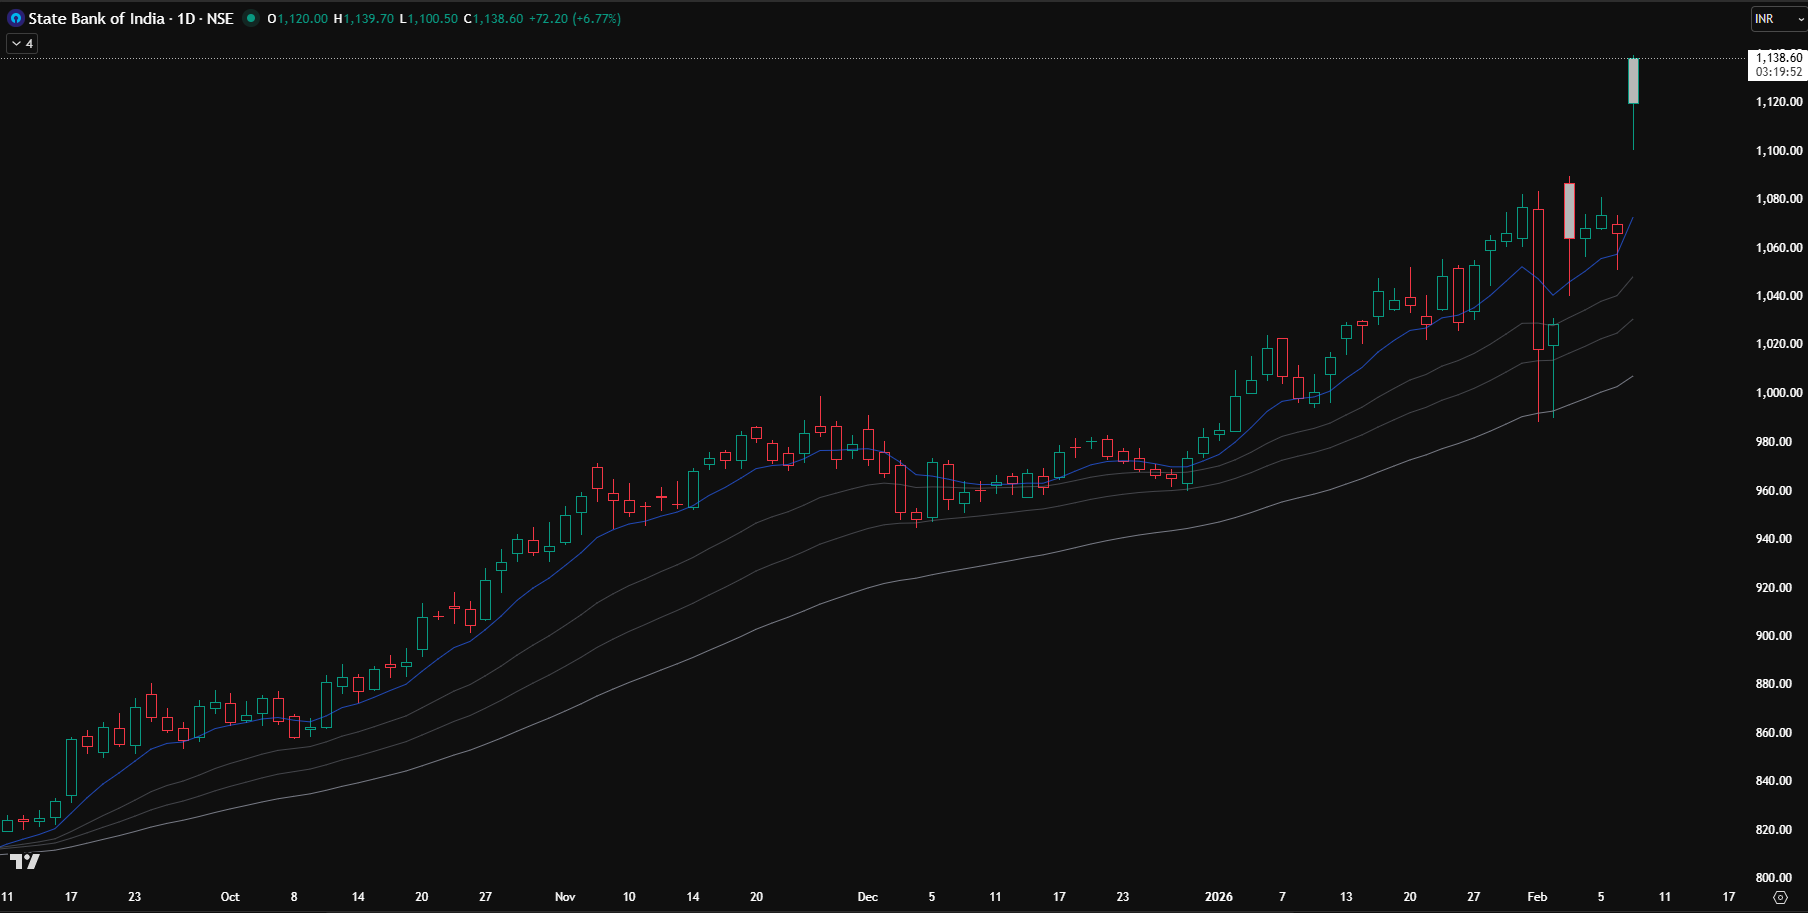
In a bullish SBI trend environment, the 8 EMA sits above the 21 EMA, the 21 above the 34, and the 34 above the 55. This stacked formation signals that buyers are in control across short-to-intermediate horizons. When the EMAs remain separated and angled upward, the trend is active rather than transitional.
A bearish phase is simply the inverse. The shorter EMAs fall below the longer ones, and all slope downward, reflecting sustained selling pressure.
The visual condition matters. A clean, layered EMA structure suggests directional clarity. When the EMAs compress or tangle, the market is shifting into balance or uncertainty. PEMA helps traders distinguish between continuation and transition without guesswork.
Reading SBI Trend Structure in Real Market Context
During SBI’s bullish trending phase, the EMA structure expands and maintains separation. Instead of overlapping, the lines form a staircase-like slope that reflects sustained buying pressure.
This type of structure tells traders that the market is favoring continuation. Rather than attempting to predict reversals, the focus shifts to participating in pullbacks. A healthy trend repeatedly tests its structure before extending higher.
When EMAs are sloped and aligned, pullbacks are typically corrective rather than reversal signals. The SBI case illustrates how structured EMA alignment can guide traders toward continuation opportunities instead of emotional decision-making.
Entering SBI Pullbacks Using EMA Tests
Trending markets advance in waves. Pullbacks are a natural reset mechanism and often provide the highest-quality entries.
In a strong SBI trend, shallow pullbacks frequently respect the 8 EMA. Price tests this level, buyers step in, and continuation follows. These reactions indicate aggressive trend participation.
In more moderate trending conditions, pullbacks may reach the 21 or 34 EMA. This deeper retracement is still structurally healthy. When price rejects these EMA zones, the expectation becomes continuation toward a new swing high in a bullish trend.
The key is not blindly entering at an EMA. Traders observe how price reacts. Acceptance and rejection behavior reveal whether the trend remains intact. The EMA zone acts as a structural test, not a mechanical trigger.
Trade Management During a PEMA Trend
Trade management is where structure-based trading becomes practical. No indicator predicts when a trend will end. Instead, PEMA emphasizes reading behavior after entry.
Once SBI reacts positively from an EMA pullback, continuation is expected. If the market fails to produce a new high after a bullish rejection, that failure signals weakening momentum. Repeated inability to extend suggests that the trend may be transitioning.
Rather than exiting based on emotion, traders respond to structural information. When price behavior contradicts expectations, position management adjusts accordingly.
For a deeper breakdown of how EMA structure and price behavior reveal transitions, you can explore this case study:
https://msptraders.in/nifty-it-index-reversal-an-ema-and-structure-based-case-study/
Practical Perspective on Trading the PEMA Trend
The SBI trending case study highlights a simple principle: structure defines opportunity. EMA alignment shows trend condition. Pullbacks provide entry context. Price behavior determines management decisions.
PEMA is not a prediction tool. It is a framework for reading momentum and participating while structure supports continuation. When continuation fails, traders reassess instead of forcing trades.
This structured approach removes emotional bias and replaces it with observable logic — the foundation of consistent execution.
If you found this SBI PEMA Trend Case Study helpful, follow along on social media for more structured market insights and practical learning.
Cheers !!
Arup MSP
Creator of Pivot Mastery (The Practical Way to Understand Market Context)
Social Profiles:
Follow on X
Follow on Facebook