
Yesterday, SPS Commerce (NASDAQ: SPSC) made headlines with a huge gap-down move that caught many traders and investors off guard. But was this fall truly news-driven, or was it a clear technical move that the charts had already hinted at earlier this month? Let’s look deeper into what really happened.
The Bigger Picture: Quarterly CPR Reveals the Direction
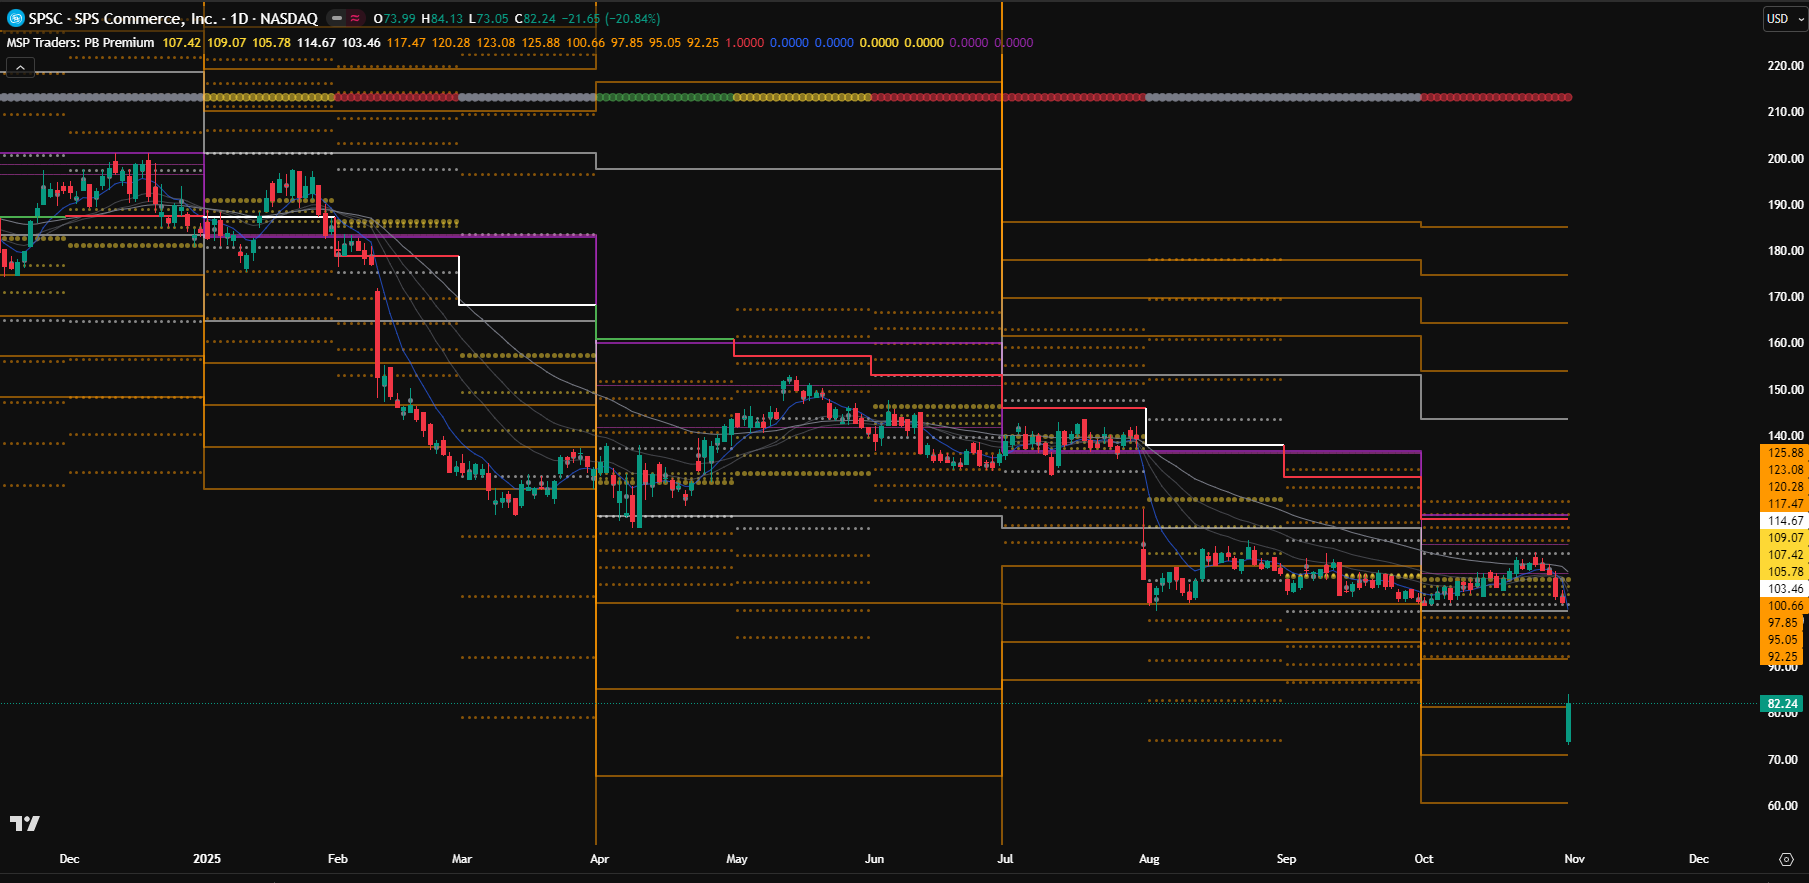
When analyzing a major drop like this, the first thing I check is the bigger picture. The quarterly CPR, shown as the purple line on the chart, gives a strong sense of long-term direction.
In October, the price opened near the previous quarter’s low and continued to trade below the quarterly CPR throughout the month. That’s an early signal that the broader trend was already bearish. When the higher timeframe trend is down, trading in that direction becomes much easier and more consistent.
Zooming In: The Monthly CPR Adds Confirmation
After identifying the broader trend, the next step is to study the monthly CPR, which is shown as yellow dotted lines in the chart.
In October, the monthly CPR was lower than the previous month’s CPR, confirming that momentum was weakening. But a lower CPR alone is not enough to declare a trend. The real confirmation comes from where the month opens and where the previous month closes in relation to the CPR.
September Closing and October Opening Confirmed the Bearish Bias
In this case, September closed below the monthly CPR, and October opened even further below it. This alignment is a clear sign of bearish continuation. It shows that sellers maintained control from one period to the next.
When both the previous month’s closing and the current month’s opening are below the CPR, it usually leads to strong downward momentum. So before the big gap-down appeared on the news, the structure was already pointing to weakness.
News vs Charts: What Really Drives the Market
After the fall, financial media outlets started offering multiple explanations—earnings reports, forecasts, sector rotation, or valuation concerns. But as traders, we know that the chart often tells the story first.
The combination of a bearish quarterly structure, a falling monthly CPR, and a weak opening setup had already set the stage. All the later news simply justified what the price had already shown weeks ago.
This is why it’s important to read the market structure instead of headlines. The chart always speaks first.
Why CPR-Based Reading Works So Well
CPR-based analysis keeps trading simple and objective. It doesn’t rely on emotions, opinions, or complex indicators. By studying how price interacts with the CPR across timeframes—especially the relationship between closing and opening—you can understand market behavior with clarity.
Once you develop this habit, you’ll notice how often the market gives early hints before any sudden move happens.
Learn the Full Process Step-by-Step
If you want to understand this approach in depth, I’ve explained it clearly in another article:
How I Identify Strong Market Trends Using Pivot Points
It covers how I use higher timeframe pivots like quarterly and monthly CPR to identify trend strength, continuation, and reversal points. Once you practice this on your own charts, patterns like SPSC’s recent drop will become much easier to spot in advance.
Final Thoughts
The big gap-down in SPS Commerce (SPSC) wasn’t a surprise to those who read the charts carefully. The bearish structure was already in place from the start of October.
Next time you see a similar move, focus on the closing and opening positions relative to the CPR instead of searching for news explanations. The market often reveals its intentions long before the headlines appear.
💬 Comment below if you’d like me to share future updates on this.
📲 Follow me on social media for regular trading insights, price behavior breakdowns, and chart updates.
Cheers !!
Arup MSP
Creator of Pivot Mastery (The Practical Way to Understand Market Context)
Social Profiles:
Follow on X
Follow on Facebook