I’ve been closely tracking Tesla’s price action over the past several quarters. The current structure on the chart is hard to ignore. I thrive on spotting potential breakout setups. This is especially true after periods of consolidation. Tesla is ticking all the boxes for a high-probability move.
Let me walk you through what I’m seeing—and why this might be a textbook case of “compression leads to expansion.”
A Tale of Two Expansions: Oct 2024 to Mar 2025
Looking back, October to December 2024 was a quarter marked by a strong upward expansion in Tesla’s price. Bullish sentiment, technical breakouts, and overall market momentum contributed to a powerful rally during that period.
Then came the twist.
January to March 2025 flipped the script completely. That quarter saw a sharp reversal to the downside—a clean and aggressive selloff, likely fueled by profit booking, valuation concerns, or shifting macro narratives. Either way, it completed a full cycle of upside expansion followed by downside expansion. These back-to-back moves created a volatile yet telling structural story.
April to June 2025: Time to Digest
After such dramatic movement, the April to June 2025 quarter served as a much-needed digestive phase. Price action slowed down, volatility contracted, and Tesla began moving sideways.
This “cooling-off” period wasn\’t just random. It was the market pausing, recalibrating, and absorbing the prior six months of aggressive price movement.
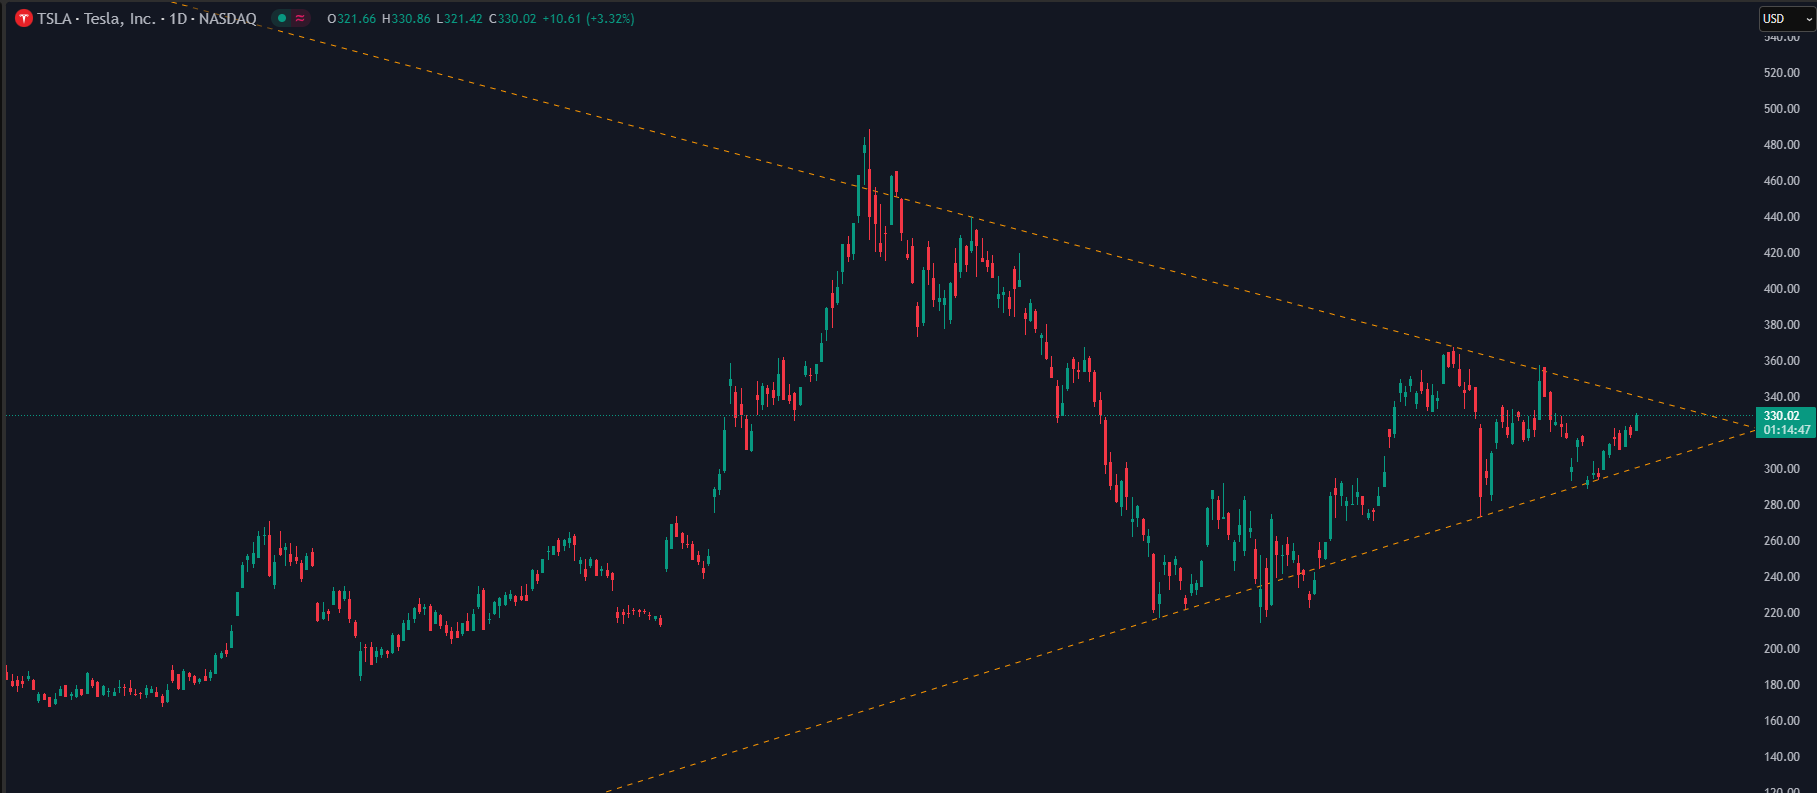
The Current Picture: Triangle Formation & Tightening Range
Now, in July 2025, Tesla’s chart shows something very interesting: a tight triangle pattern forming on the daily and weekly timeframes. Price is compressing, forming lower highs and higher lows, creating an equilibrium zone that is just waiting to be broken.
This setup is often the calm before the storm.
Why does this matter?
Because markets move in cycles of expansion and compression. What we’re seeing is a textbook transition:
- Oct 2024 to Mar 2025 = Expansion
- Apr to Jun 2025 = Compression
- Now = A potential new Expansion phase
What’s Next? Watch the Breakout
Triangle patterns don’t predict direction, but they do signal potential volatility ahead. Once Tesla breaks out of this structure, the move is likely to be powerful, mirroring the energy stored during the compression.
Whether it’s a breakout or a breakdown, I’ll be watching:
- Volume confirmation
- Retests of breakout levels
- Daily/weekly closes outside the triangle
These will be the clues to validate the next leg of expansion.
Final Thoughts
Tesla has always been a stock that attracts attention, volatility, and big swings. But what sets the current setup apart is the structure: a classic compression following a powerful expansion cycle. That’s usually the signal I need to start preparing for an opportunity.
This isn’t a buy/sell recommendation. It’s an observational breakdown of market structure. As always—plan your trade, manage your risk, and respect the market.
Disclaimer: This article is for educational and informational purposes only. It does not constitute financial advice or a recommendation to buy or sell any financial instrument. Markets involve risk, and you should do your own research or consult a licensed advisor before making investment decisions.