
Every financial market runs a continuous auction. Buyers bid, sellers offer, and price moves until balance is achieved. Beneath standard candlestick patterns lies a deeper narrative—a story told through volume profiles, high-volume nodes (HVNs), low-volume nodes (LVNs), and institutional footprint spikes.
When traders feel trapped by sudden reversals, it is usually because they are reacting to lagging price action rather than reading where smart money is actively stepping in, absorbing liquidity, or exhausting momentum. By analyzing volume profile dynamics alongside specific volume spike indicators, you can map the market’s structural boundaries and execute trades with institutional alignment.
The Institutional Footprint: Decoding Volume Spike Indicators
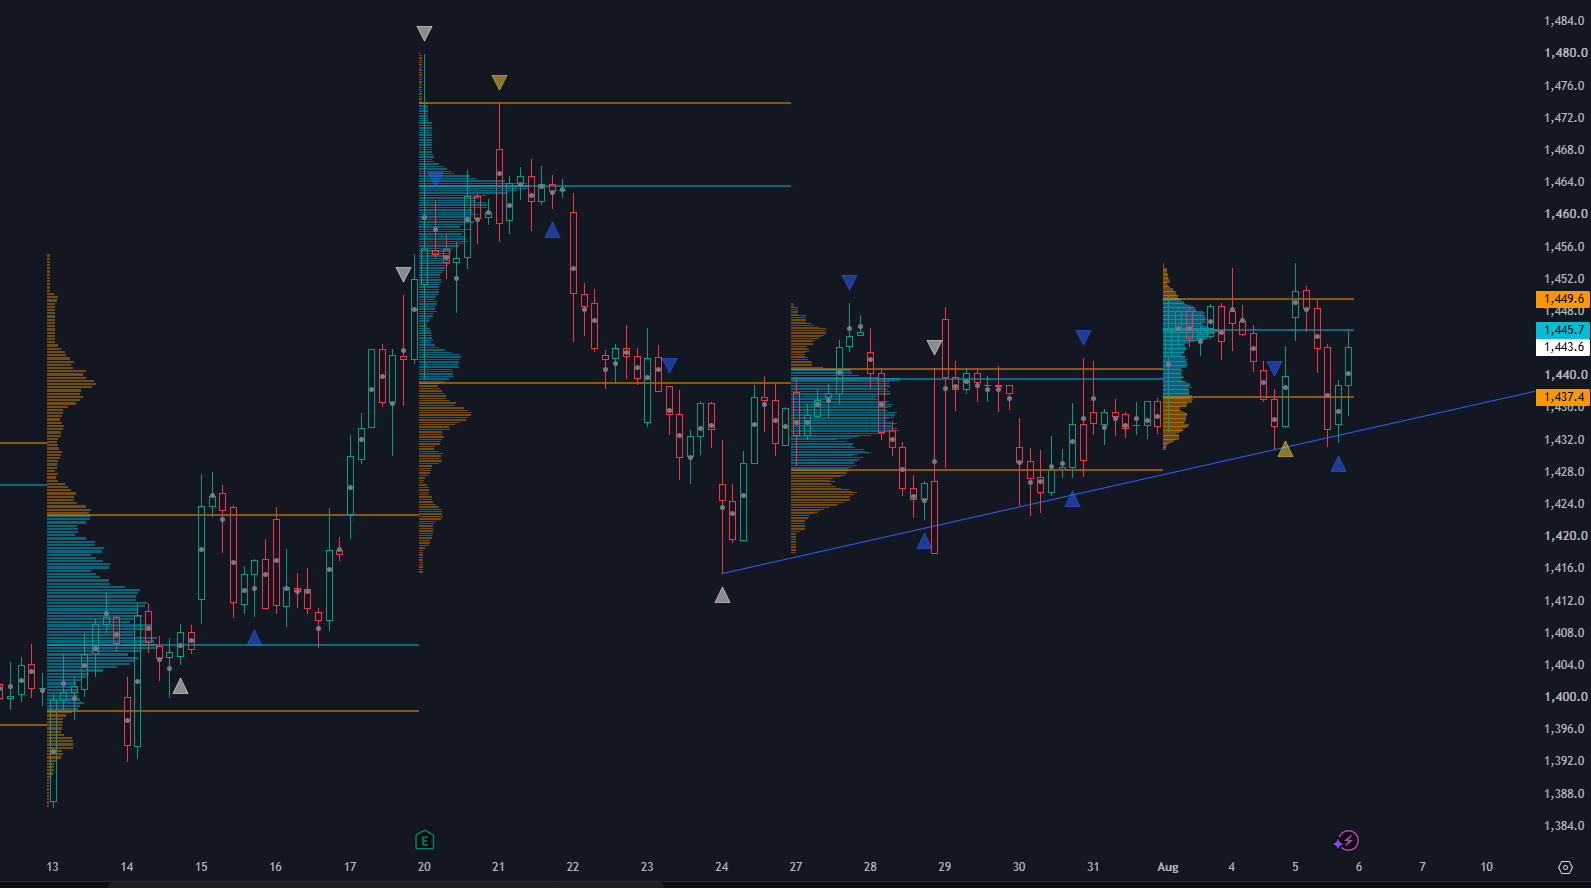
Volume represents the footprint of institutional market participants. Large orders leave distinct signatures on a chart that cannot be hidden. To track these footprints, three volume spike markers identify shifts in supply and demand:
| Indicator Marker | Volume Threshold | Core Market Function | Primary Interpretation |
| White Triangle | 20-Bar High Volume Extreme | Capitulation / Peak Exhaustion | Extreme volume event signalling buying/selling exhaustion or heavy passive absorption. |
| Yellow Triangle | 200%+ Volume Spike | Aggressive Defense / Initiative | Institutional effort defending structural boundaries or driving major breakouts. |
| Blue Triangle | 150%+ Volume Spike | Tactical Momentum / Intermediary Defence | Local momentum confirmation or secondary defense during consolidation. |
Chronology of an Auction: The Four Profile Blocks
Analyzing volume profiles across distinct chronological blocks reveals how market value migrates over time, laying the groundwork for key support and resistance zones.
[ Jul 13–17: Base Accumulation ] ──► [ Jul 20–23: Top Distribution ]
                                                 │
[ Aug 01–06: Compression / Hub ] ◄── [ Jul 27–31: Value Acceptance ]
1. July 13 – July 17: Base Profile & Accumulation
The auction established strong price acceptance within the 1400.0 to 1425.0 range, forming a thick High-Volume Node (HVN) anchored below 1420.0. Once buyers absorbed the available supply at the 1425.0 resistance boundary, an aggressive markup phase was triggered, propelling price directly toward 1480.0.
2. July 20 – July 23: Distribution Block & Rejection
Following the markup, heavy institutional volume accumulated near the high end between 1450.0 and 1470.0. However, acceptance at these higher levels failed. A sharp sell-off back below 1450.0 left a low-volume air pocket, establishing 1464.0 as a major overhead distribution resistance node.
3. July 27 – July 31: Balance Phase & Value Acceptance
Following the initial drop from the top, price stabilised into a well-defined neutral profile between 1425.0 and 1450.0. The central Point of Control (POC)—the level of maximum volume traded—settled around 1438.0–1440.0, reflecting temporary equilibrium between buyers and sellers.
4. August 1 – August 6: Current Compression Hub
The auction has narrowed into a tight compression structure:
- Value Area Upper Boundary: ~1450.0
- Current POC / Lower Boundary: ~1437.4 – 1445.7
- Active Trading Price: Currently oscillating directly inside the high-volume node at 1445.7.
Real-World Case Studies: Dissecting Key Pivot Footprints
                       ▲ 1482.0 (White Triangle: Exhaustion High)
                      / \
                     /   \ ▲ 1476.0 (Yellow Triangle: 200% Distribution)
                    /     \
                   /       \ ▲ 1460.0 (Blue Triangles: Failed Reclaim)
                  /         \
  1431.0 ▲ ──────┼───────────┴─ ▲ 1413.0 (White Triangle: Capitulation Low)
(Yellow 200%     │
 Trend Defense)  └─── Ascending Support Trendline
Examine how these volume spike indicators marked critical structural pivots across the chart:
- The Exhaustion Peak (July 20 at 1482.0): A White Triangle appeared at the absolute high of 1482.0. Retail traders chased the rally, but the immediate reversal signalled buying exhaustion. Passive institutional limit orders absorbed all market buying, creating a sharp top.
- The Distribution Confirmation (July 20 at 1476.0): Immediately following the peak, a Yellow Triangle (200%+ volume spike) hit near 1476.0, confirming heavy aggressive selling and institutional distribution.
- The Intermediate Resistance Tests (July 21–23 near 1460.0): As price attempted to recover, multiple Blue Triangles (150%+ volume spikes) appeared around 1460.0, marking failed buyer pushes and seller defence of the upper range.
- The Capitulation Bottom (July 24 at 1413.0): At the tail end of the sell-off, a White Triangle emerged at 1413.0. Aggressive market selling was met with institutional absorption, forging the major low that anchors the ascending trendline.
- Consolidation Support Defence (July 27–31 near 1420.0–1428.0): During sideways consolidation, Blue Triangles repeatedly triggered around 1420.0–1428.0, showing buyers stepping in to absorb supply at the lower boundary.
- The Trendline Line in the Sand (August 5 at 1431.0): Price retested the ascending support line connecting the 1413.0 low (July 24) and 1420.0 low (July 29). Right at 1431.0, a Yellow Triangle (200%+ volume spike) appeared as buyers defended the trendline, driving a bounce back toward 1445.7.
Structural Key Zones
To trade this structure effectively, map the market into three operational zones:
1. Overhead Distribution Zone (1450.0 – 1476.0): Major overhead supply node centered at 1464.0, capped by the 1450.0 structural ceiling.
2. Neutral Balance Hub (1437.4 – 1445.7): The current price acceptance area, where the market is balancing near the 1445.7 high-volume node.
3. Demand Floor & Trendline Support (1431.0 – 1437.4): Crucial support defined by the ascending trendline and verified by the 200% volume defense at 1431.0.
The Complete Trading Playbook: Managing 3 Auction States
Because price is currently compressing between 1431.0 and 1450.0, trade execution depends on whether the auction remains in range balance or breaks into directional expansion.
                        [ BULLISH EXPANSION ]
                        Breakout > 1450.0 (Target: 1464.0 ──► 1476.0)
                               ▲
                               │
 ─── Range High: 1450.0 ───────┼─────────────────────────────────────
                               │  [ NEUTRAL / RANGE STATE ]
                               │  Fade 1450.0 / Buy 1431.0–1437.0
 ─── Range Low:  1431.0 ───────┼─ POC Target: 1443.0
                               │
                               ▼
                        [ BEARISH EXPANSION ]
                        Breakdown < 1431.0 (Target: 1420.0 ──► 1400.0)
Scenario 1: The Neutral / Range State (Current Market)
When price remains confined inside a balanced volume profile, execute mean-reversion strategies by trading the edges and targeting the centre.
- Long Setup (Range Low Defence):
- Entry Zone: Buy near Value Area Low / Trendline support between 1431.0 and 1437.0.
- Stop Loss: Place just below structural support at 1428.0.
- Profit Targets: Target the central POC at 1443.0, then Value Area High at 1449.6 – 1450.0.
- Short Setup (Range High Resistance):
- Entry Zone: Sell near Value Area High resistance between 1449.0 and 1450.0.
- Stop Loss: Place above the distribution block at 1454.0.
- Profit Targets: Target the central POC at 1443.0, then Value Area Low at 1437.0.
- Position Management: Reduce position sizes to manage range chop. Take 50% to 70% profits at the central POC (1443.0) and move stop losses to breakeven.
Scenario 2: Bullish Expansion (Breakout Above 1450.0)
A sustained 30-minute candle close above 1450.0 transitions the market from balance to imbalance, signalling buyer control.
- Entry Execution: Enter on a 30-minute candle close above 1450.0 accompanied by high volume, or on a retest of 1450.0 holding as new support.
- Stop Loss: Position inside the prior balance range near 1443.0.
- Target & Trailing Strategy: Take partial profits at the 1464.0 HVN rejection node and hold the remainder for 1476.0+. Trail stops behind local higher lows or Low-Volume Nodes (LVNs).
Scenario 3: Bearish Expansion (Breakdown Below 1431.0)
A breakdown below 1431.0 breaks both the ascending support trendline and the lower value boundary.
- Entry Execution: Short upon a confirmed candle close below 1431.0, or on a retest where 1431.0–1437.0 flips to resistance.
- Stop Loss: Position above the balance midpoint at 1440.0.
- Target & Trailing Strategy: Scale out 50% at the 1420.0–1424.0 volume block, targeting the base auction profile at 1400.0. Trail stops behind local swing highs.
Decoding Order Flow Signals: Continuation, Exhaustion & Reversals
To prevent getting caught on the wrong side of a move, evaluate order flow confirmation at key structural boundaries:
CONTINUATION:  Breakout ──► Low-Volume Nodes (LVNs) ──► 150%/200% Spike ──► Holds Retest
EXHAUSTION:    Extreme Move ──► Thick HVN Node ──► 20-Bar White Spike ──► Rapid Rejection
REVERSAL:      Failed Breakout ──► 200% Defensive Spike ──► Crosses POC to Opposite Side
1. Signs of Trend Continuation (Imbalance & Acceptance)
- Profile Mechanics: Price breaks out of value leaving Low-Volume Nodes (LVNs) or single prints, reflecting aggressive market orders driving price without rotational overlap.
- Spike Confirmation: A Blue (150%) or Yellow (200%) volume spike fires on an expansion candle in the direction of the breakout.
- Price Behaviour: Retests hold above (for longs) or below (for shorts) the breakout boundary without re-entering the prior profile’s central POC.
2. Signs of Trend Exhaustion (Rejection & Absorption)
- Profile Mechanics: Heavy volume builds a thick High-Volume Node (HVN) at a price extreme, but price fails to progress, signalling passive limit orders absorbing aggressive market orders.
- Spike Confirmation: A White Triangle (20-bar high) or Yellow Triangle (200%) appears at a new extreme (similar to the 1482.0 peak on July 20).
- Price Behaviour: Price leaves long wicks at the extreme and rapidly closes back inside the previous value area.
3. Signs of Trend Reversal (Failed Auction)
- Profile Mechanics: Price attempts to break out of balance but fails to accept outside the range, reversing back through the central POC toward the opposite boundary.
- Spike Confirmation: Heavy volume spikes (Yellow or White) fire during a level retest followed by an immediate counter-candle (similar to the August 5 1431.0 trendline defence).
- Price Behaviour: A failed breakout triggers a strong directional push that reclaims structural levels back inside 1450.0 or below 1431.0.
Successful auction trading relies on location, institutional volume confirmation, and objective risk parameters. Respect the upper ceiling at 1450.0, monitor the trendline defence at 1431.0, and align your entries with institutional volume spikes.
Cheers !!
Arup MSP
Creator of Pivot Mastery (The Practical Way to Understand Market Context)
Social Profiles:
Follow on X