
In my previous post, Volume Profile Trading: Read Institutional Footprints, I shared how institutional operators leave clear structural clues on the chart through volume distribution and value areas. Today, I want to take that concept a step further and walk you through how I evaluate a chart in real time when price approaches a critical resistance boundary.
When I watch price push into a major technical zone, my primary objective isn’t to guess what happens next. Instead, I try to answer one fundamental question: Is the market genuinely attempting to build acceptance at higher valuations, or am I looking at a classic structural rejection that favours a pullback? By analysing the recent price action on this chart around the 1,459.0 to 1,460.0 region, I’ll show you how I combine channel dynamics, volume profile, and momentum shifts to make that determination.
The Structural Context: Tracking Value Higher
Before I ever zoom in on an individual candle or resistance line, I always step back to look at the broader market structure. On this chart, price has been traversing cleanly inside an ascending parallel channel, forming a steady sequence of higher highs and higher lows that tells me buyers have been in control overall.
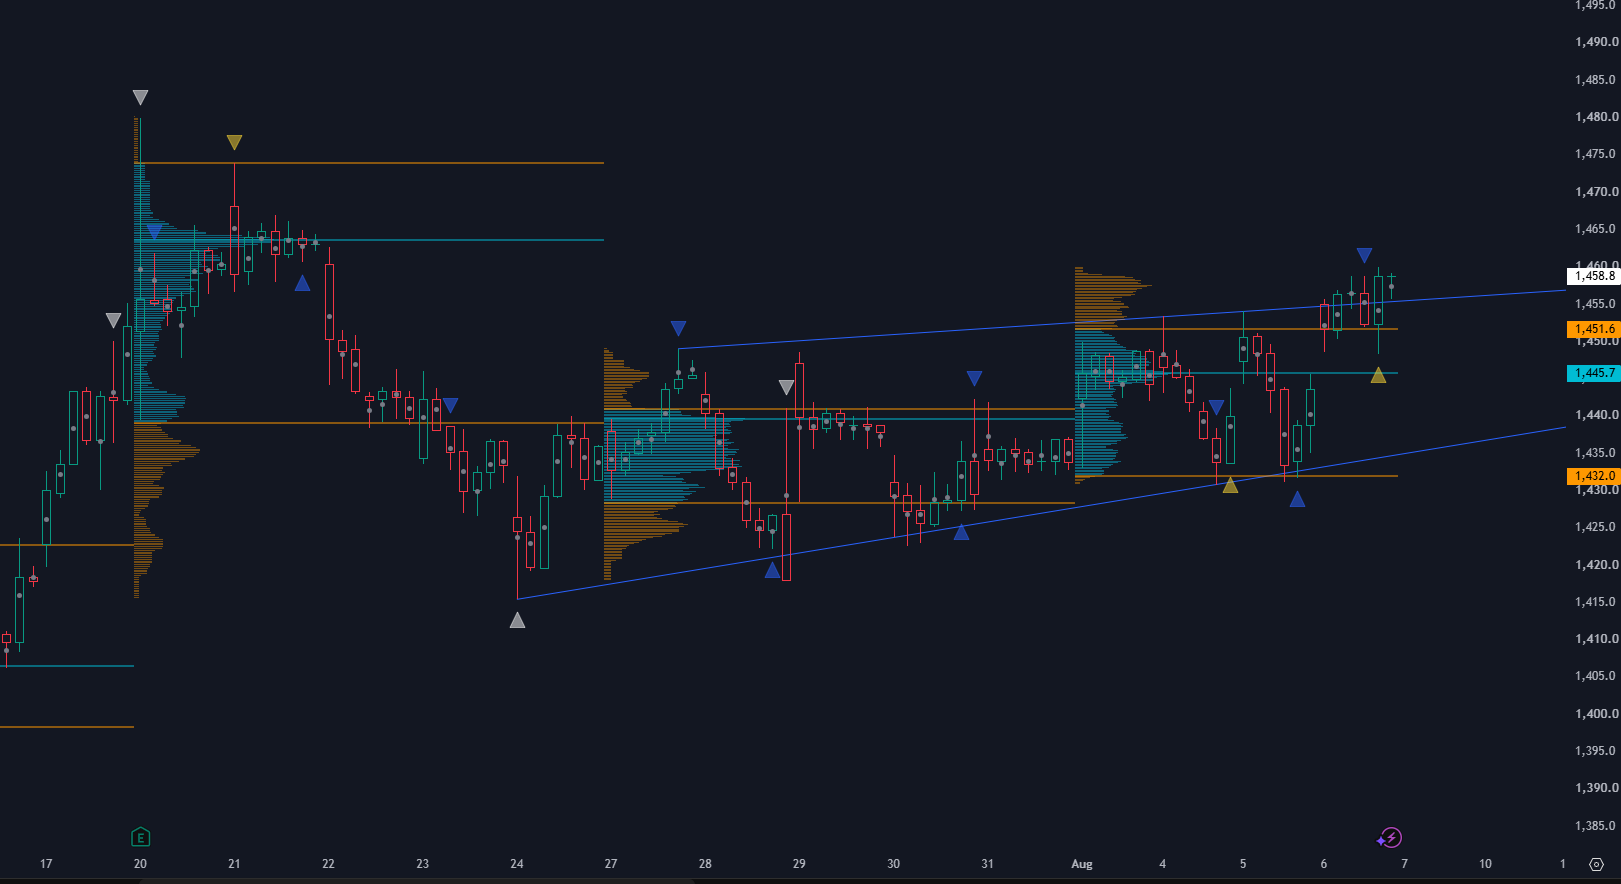
Parallel to this channel, the volume profile reveals something even more interesting—a distinct upward migration of value across recent periods. When I inspect the earlier price action, value was concentrated lower down in the 1,429.5 to 1,441.8 zone, anchored by a heavy High Volume Node between 1,435.0 and 1,438.0. As buyers pushed price upward, that entire value zone shifted into the 1,442.0 to 1,458.0 range. That shift proved to me that traders were comfortable accepting higher prices throughout the rally. However, as we touch the upper boundary near 1,459.0, the dynamic changes rapidly.
Why I See Rejection at the 1,460 Horizon
As price tests the 1,459.0 to 1,460.0 zone right now, I see clear technical evidence of rejection rather than an institutional breakout. This specific price level is a major confluence point where our Value Area High, local swing highs, and the upper rising trendline of our parallel channel all collide.
When I look closely at the candlestick geometry at this ceiling, the price action speaks volumes. Every time price attempts to breach 1,459.0, aggressive sellers step in to supply liquidity, leaving behind prominent upper wicks alongside automated sell-side signals. Looking over at the volume profile on the right, the volume thins out drastically above 1,459.0. If big institutional buyers were eager to push this higher, we would see thick volume accumulating above resistance. Instead, that thin profile tells me there is very little transactional interest at these higher levels.
What True Acceptance Would Look Like to Me
As a structure trader, I never try to front-run a breakout. I prefer to wait for the market to prove that buyers are genuinely establishing acceptance above 1,460.0 before changing my bias.
For me to consider this a true breakout, I first need to see a strong, full-bodied candle close above 1,460.0, leaving minimal upper wicks. Following that close, I want to see heavy trading volume building above 1,460.0 to form a brand new High Volume Node. Finally, I look for a clean retest of the 1,459.0 to 1,460.0 zone where former resistance holds firmly as new support. That resistance-turned-support flip gives me the ultimate structural confirmation that buyers are defending their new ground.
How I Am Playing This Structure
With strong rejection signals printing at resistance, I am framing my execution around two straightforward scenarios.
My primary scenario favours a mean-reverting rotation back down into the structure. As long as price fails to secure a high-timeframe close above 1,459.0, my short-term bias favours a pullback toward our primary horizontal support at 1,441.8, which marks the top of our previous value zone. If selling pressure accelerates from there, the move could easily extend toward the lower channel trendline near 1,436.0, where historical volume sits ready to absorb liquidity.
My secondary scenario is a breakout expansion. If buyers step in with expanding volume and close firmly above 1,460.0, it invalidates the channel resistance and tells me we are entering a new trend expansion phase toward higher, uncharted targets.
Wrapping Up
Trading major levels effectively comes down to reacting to confirmed institutional order flow rather than guessing breakouts in advance. By watching how volume distribution interacts with channel boundaries, you can stay on the right side of the market’s true intent.
If you enjoyed this breakdown, follow me to get my latest technical analysis, volume profile insights, and real-time trade setups as they develop!
Cheers !!
Arup MSP
Creator of Pivot Mastery (The Practical Way to Understand Market Context)
Social Profiles:
Follow on X